

Compliance stops being a paperwork exercise and becomes manageable when it is measurable. The difference is a clear trace from legal or regulatory requirement → control → owner → verifiable evidence. Without that chain, teams arrive at audits with a lot of activity but little ability to prove what is under control, what is delayed, and what risks remain open.
This article is practical, not legal advice. It is written for DPOs, compliance managers, CISOs, risk managers, internal auditors and consultants who need indicators that survive audit scrutiny — not decorative metrics that fall apart when evidence is requested.
Why compliance needs verifiable indicators
Indicators are not about scoring a compliance program for reporting’s sake. They are about answering, at any moment, whether controls are implemented, operating, evidenced and remediated on time.
Regimes such as GDPR, NIS2 and DORA emphasize the same operational expectation: policies alone are not enough. Organisations must be able to demonstrate governance, risk management, continuity and incident response. Indicators are the operational tool that lets you show, not just claim, that these capabilities exist.
A useful indicator answers three questions: which requirement does it cover, which control implements it, and what evidence proves it. If any of those links is missing, the metric may help management but it will be weak in an audit.
Start from requirements, then build the traceability chain
A common mistake is to start with dashboards and work backwards. The right sequence is: define regulatory or framework perimeter → map requirements to controls → assign owners and frequencies → capture evidence. That creates a defensible number: if your dashboard says “85% of controls complete”, an auditor must be able to drill down to see which controls are included, who owns them, when they were tested and which files prove the work.
For this evidence-first approach it helps to start with a solid structure for audit evidence; see our guide on audit evidence at /en/blog/evidenze-di-audit.
Minimum traceability chain:
- Requirement: which obligation or framework clause applies? Output: mapped requirement, scope and references.
- Control: how is the requirement addressed? Output: documented control, frequency, owner.
- Evidence: what proves the control worked? Output: files, logs, tickets, minutes, exports.
- Indicator: how do we monitor status, quality and delays? Output: KPI/KCI/KRI with thresholds and trends.
When those four levels are joined programmatically rather than reconstructed manually before an audit, your compliance becomes governable and defensible.
Three families of indicators: KPI, KCI, KRI
Mature dashboards separate indicators by purpose:
- KPI (Key Performance Indicator): progress and execution (e.g., percentage of scheduled control activities completed this quarter).
- KCI (Key Control Indicator): effectiveness of the control itself (e.g., rate of access review exceptions detected vs expected).
- KRI (Key Risk Indicator): signals of rising exposure (e.g., recurring incidents, critical suppliers without recent assessment).
If you need more on risk-focused indicators, see /en/blog/key-risk-indicators.
Essential indicators to track
Below are the practical indicators that form a minimal, audit-ready set.
-
Coverage of controls: percent of applicable requirements that have at least one active control mapping. Simple formula: requirements with ≥1 active control ÷ total applicable requirements. Coverage shows design completeness, not effectiveness.
-
Evidence currency and quality: percent of evidences updated within the required timeframe, number of incomplete or mislinked evidences. Useful evidence types include review minutes, access logs, tickets, vulnerability reports, processing records, training completions, continuity test results and supplier attestations.
-
Ownership completeness: percent of controls without an assigned owner or with owners not updated after org changes. Also track evidences overdue by owner to spot overloaded teams.
-
Findings and remediation metrics: open findings by severity, overdue remediations, actions closed without evidence, average days to close and re-open rate. For lifecycle management, link these to a structured non-conformity registry; see /en/blog/come-strutturare-il-registro-delle-non-conformita-e-le-azioni.
-
Incidents tied to controls: number of incidents that indicate control failure, with root-cause analysis. Incident logs and RCAs are the required evidence.
-
Supplier reassessments: count of critical vendors without recent review or attestation; evidence: vendor assessments or certificates.
A small set of well-defined indicators is more valuable than dozens of poorly linked metrics. Trends are often more informative than point-in-time values.
Example dashboard visual
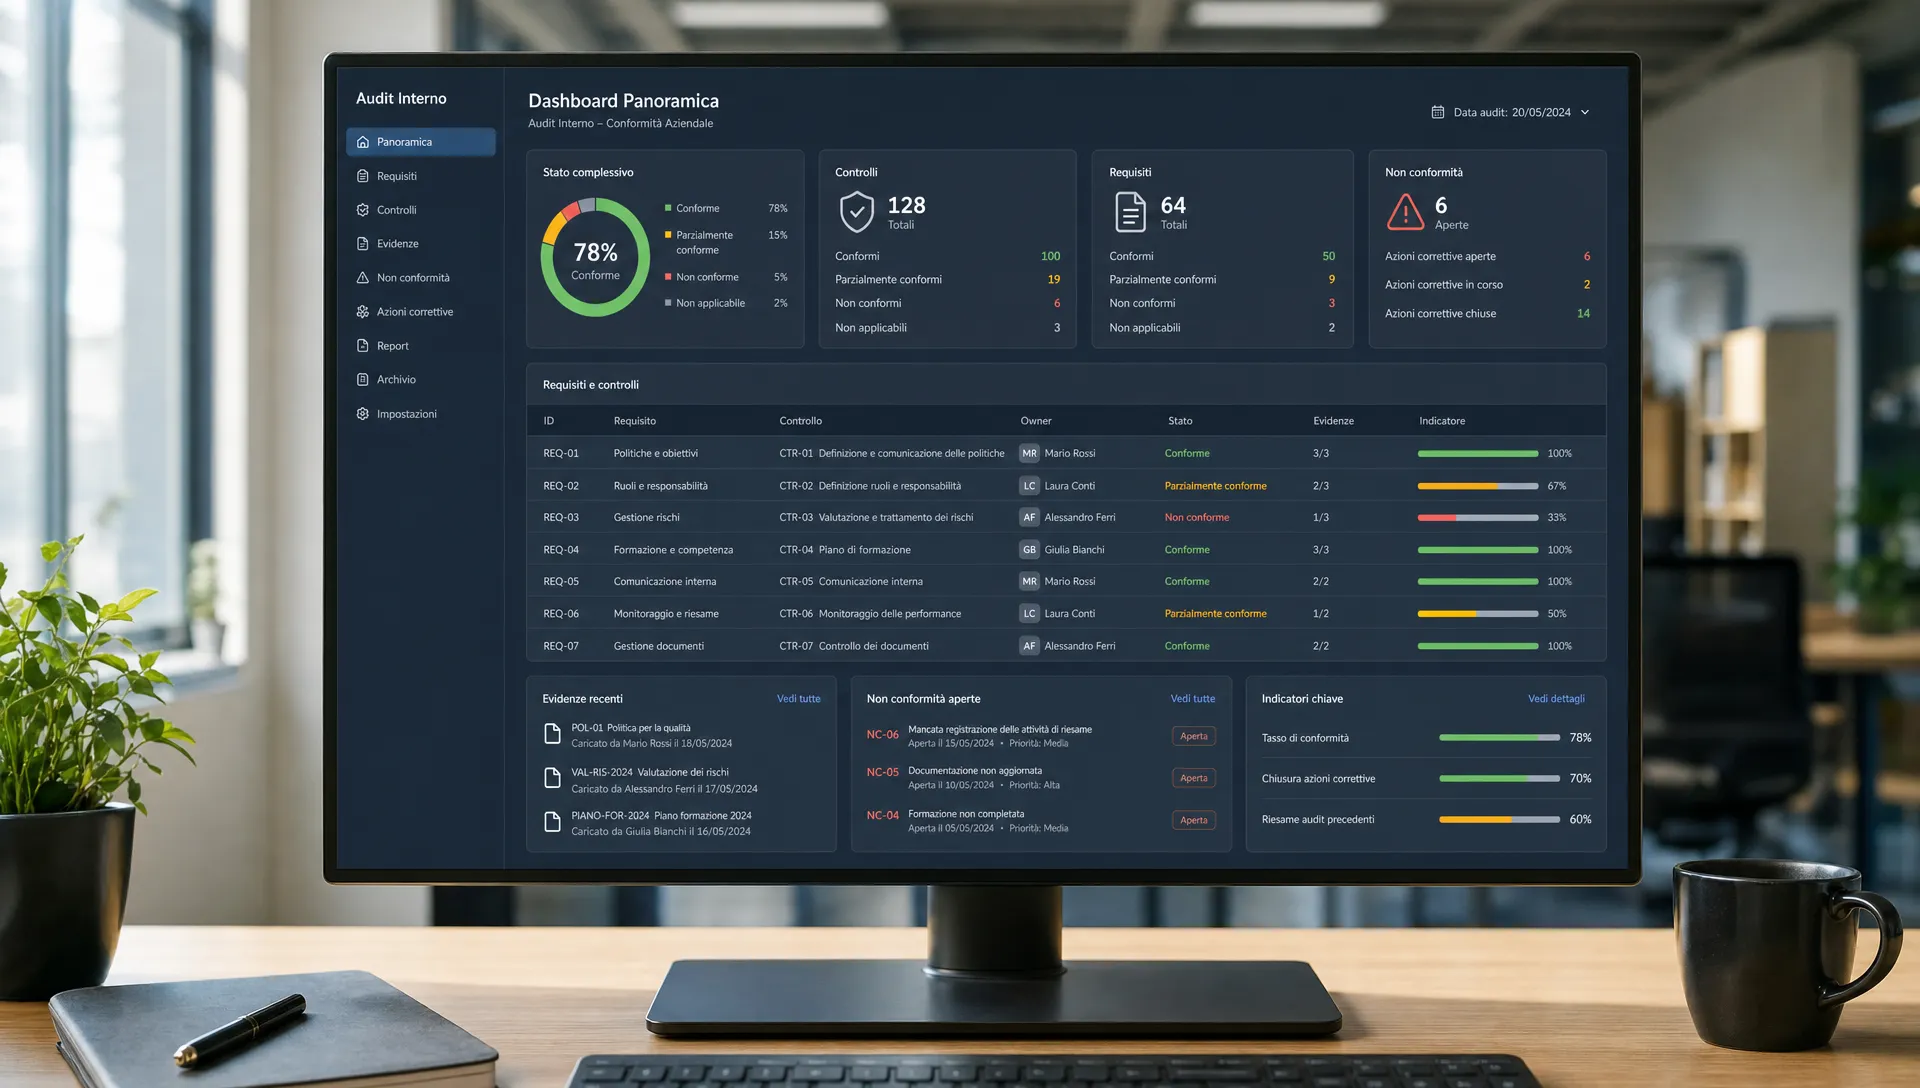
Setting thresholds, frequencies and escalation rules
An indicator without thresholds informs but doesn’t guide action. Define what is acceptable (green), what requires attention (amber) and what triggers escalation (red). Thresholds must be realistic, documented and aligned with the process risk.
Examples:
- A privileged access review may be monthly with a very low tolerance for missing evidence.
- An annual training control can have a wider completion window.
A simple operational state model works well:
- Green: control executed, evidence valid, no overdue actions.
- Amber: partial evidence, minor delay, remediation in progress with owner assigned.
- Red: control not executed, evidence absent, remediation overdue or unacceptable risk.
Escalation must be recorded: who was notified, when, what decision was made and the agreed follow-up.
Make indicators defensible in audit
An indicator is defensible when it can be reconstructed. That requires an audit trail: timestamps, versions, approvals, owners and explicit links between a synthetic metric and the underlying evidence. Manual copying between sources increases error risk and weakens defendability.
Document for each metric: definition, formula, data source, update frequency, metric owner, thresholds, escalation rules and pointer to the evidence. If any of these is missing the metric is still useful, but it is immature and likely to be challenged in an audit. See also our best practices on audit trails at /en/blog/audit-trail-best-practices.
Operational example: privileged access review across frameworks
A periodic privileged access review is a single control that can satisfy obligations under GDPR, information security standards, NIS2 or DORA depending on scope.
Potential measurable values:
- percent of privileged accounts reviewed
- number of exceptions opened
- accounts disabled following review
- missing evidences
- average days to close anomalies
Every value should link to proof: account export, review minutes, revocation tickets, system owner approvals and exception registers. Compliance is measured by the full lifecycle: rule defined → control executed → anomaly found → corrective action assigned → closure documented → subsequent verification.
Common measurement mistakes to avoid
- Counting only what’s easy: number of policies published or hours of training can be useful but do not prove control effectiveness.
- Confusing documented state with operational state: an approved procedure does not guarantee execution; check samples and test outcomes.
- Metrics without owners: unowned indicators are rarely maintained or trusted.
- Dashboard updates only before audits: indicators should flag issues early so they are fixable, not discovered at audit time.
A compliance dashboard should be compact, explainable and live. If it requires a two-hour briefing to understand, it likely contains too many or poorly modelled metrics.
FAQ
Q: What’s the difference between KPI, KCI and KRI for compliance? A: KPIs track execution and performance, KCIs measure control functioning, and KRIs warn of rising exposures. Auditors expect a combination of all three, each backed by evidence.
Q: How many indicators do I need? A: Start small: coverage, evidence currency, open findings and overdue remediation. Expand by risk and framework needs.
Q: Can an indicator replace audit evidence? A: No. Indicators monitor state and trends; evidence proves activity. Auditors will ask you to open a metric and show the underlying proof.
Q: Are indicators mandatory under GDPR, NIS2 or DORA? A: Regulations require implementable measures, governance, risk management and demonstrable controls. Indicators are a practical way to demonstrate monitoring and control, but legal and technical obligations must be assessed by qualified advisers.
From metric to evidence: build an audit-ready pack
The value of a metric is that it can be traced to proof. A useful dashboard lets you jump from requirement → control → evidence → owner → remediation. If your first perimeter to put under measurement is GDPR, you can request an operational demo of AuditReady’s GDPR evidence management at /auditready/lp/gdpr.
AuditReady helps connect controls, responsibilities, evidence and remediation so you don’t end up with a last-minute evidence hunt. This is operational advice, not legal counsel.
audit-ready evidence pack demo / not legal advice